

This map, created by Gavin Rozzi, showcases the diverse population density of New Jersey communities at the Census tract level through the use of 3D visualization techniques and selected annotations of municipalities. It took first place in NJDEP’s 34th Annual GIS Mapping Contest.
The population density of each Census tract in New Jersey was computed using R and used to render the height of each Census tract polygon based on its population density value using the Rayshader R package. Higher tracts had higher density and vice versa.
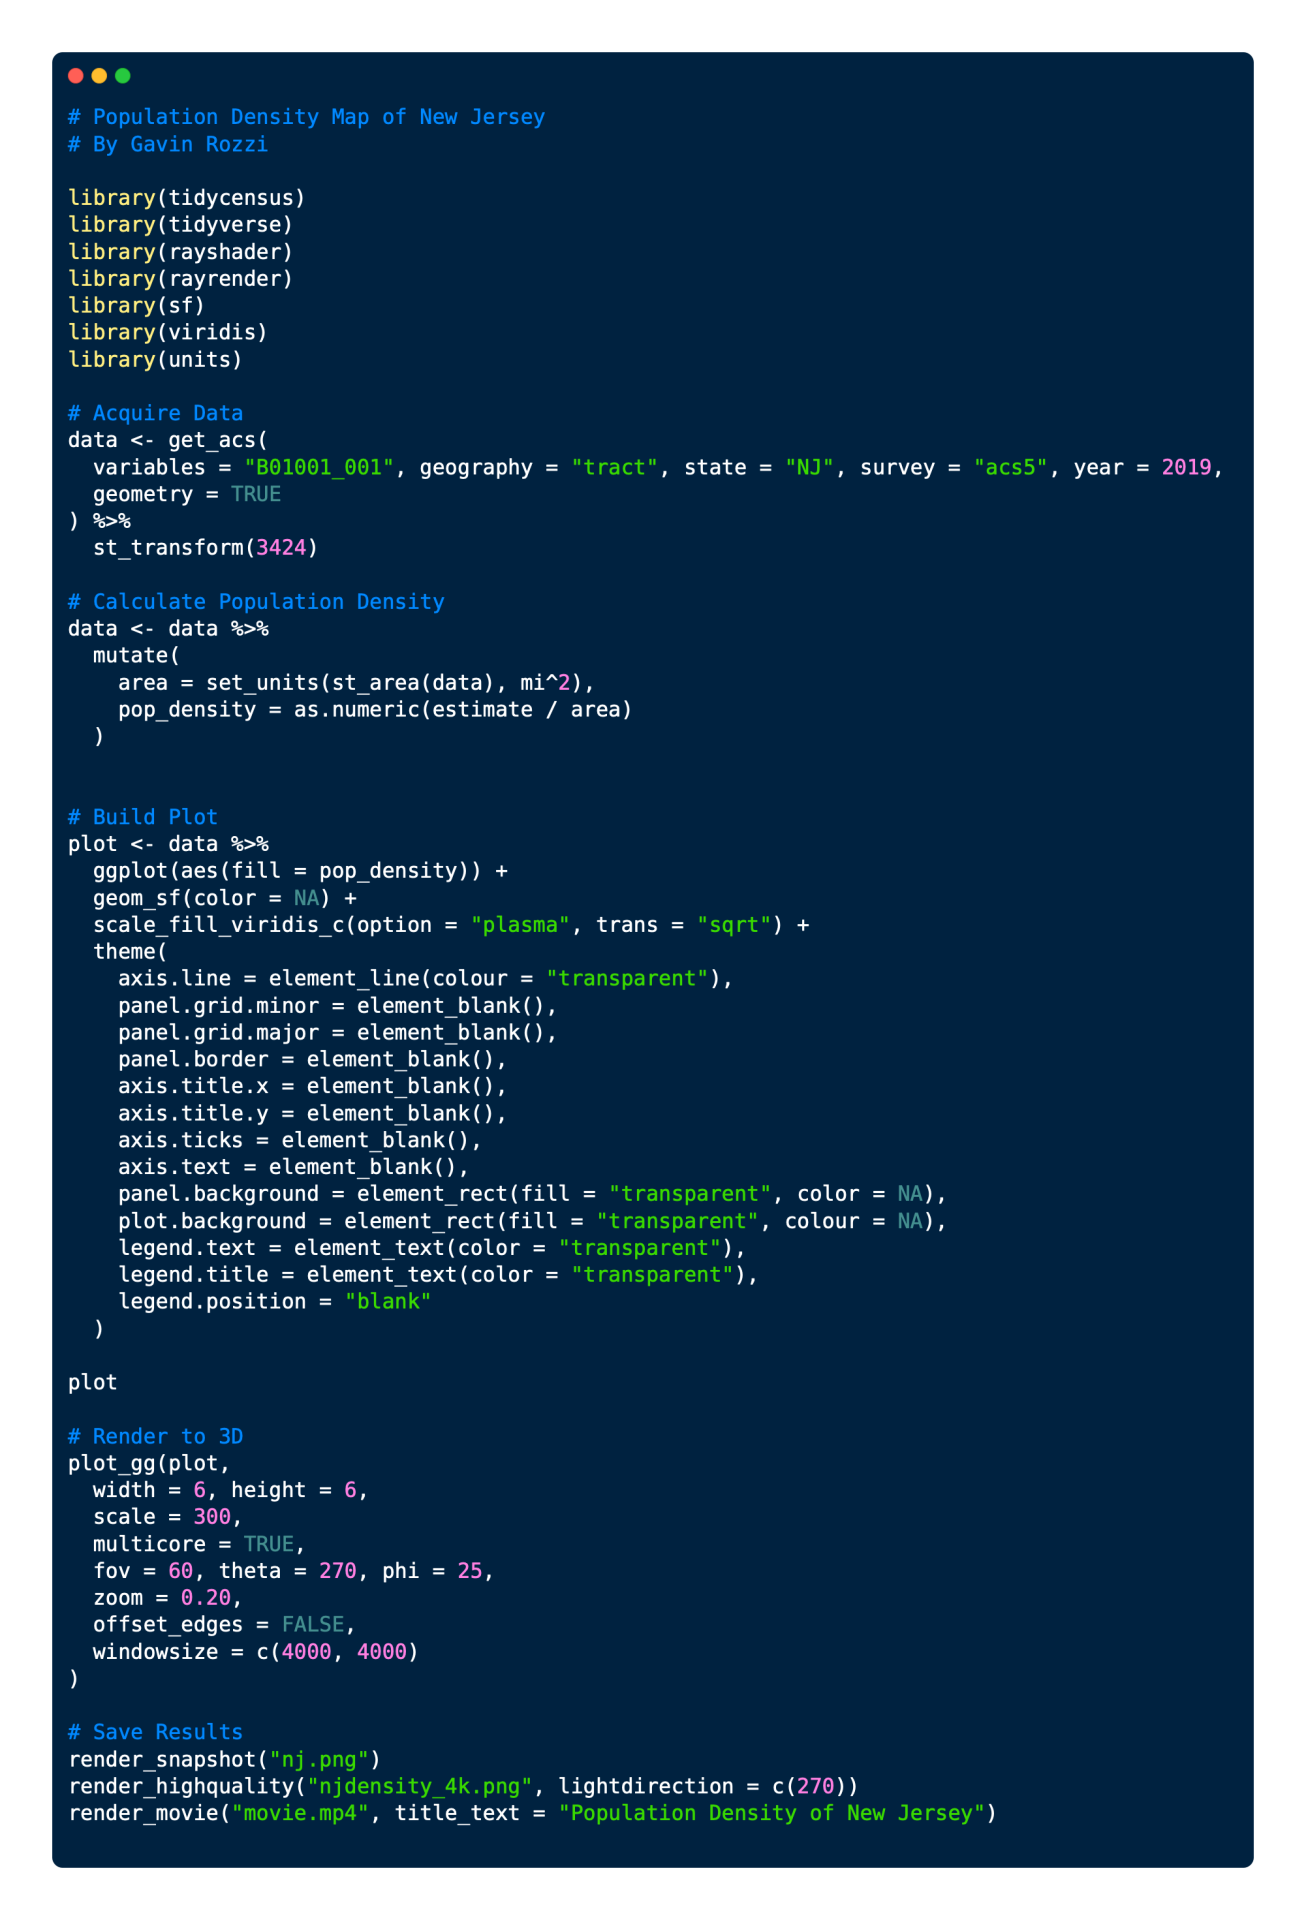
A 2D version of the map was first produced using the ggplot2 package and converted to 3D by using rayshader. This 3D map was raytraced and a high resolution render was created in R using the rayshader package, with layout and annotation done in Adobe Photoshop. All code used to generate the 3D rendering is open source and available for reproducibility.
Additionally, a physical version of this map has been created via a 3D printer. The physical version matches the 3D rendering and is a unique way of bringing cartography into 3D space.