

Recent increases in the use of wearable technology has opened up many new avenues of research. There are now vast numbers of wearable devices on the market which are used to record fitness and other leisure activities, monitor personal health and safety, and for travel and navigation.
Examples include smartphones with their increasingly greater number of integrated sensors, widely-available stand-alone devices such as GPS or motion sensors such as accelerometers, gyroscopes and magnetometers, and more specialized devices such as wearable cameras, or others that monitor eye-tracking, galvanic skin response, and facial expressions. The usability of these devices to evaluate movement and mobility patterns, or physiological processes or behaviors differ vastly, as do the reliability of the data generated (Thakuriah, et al. 2020) and their ethical, privacy and data governance implications (Sila-Nowicka and Thakuriah, 2016).
Detecting physical distancing when there are no health emergencies in place using continuous 5-second image data
One recent stream of work led by RUCI Lab Director and Distinguished Professor Vonu Thakuriah (with collaborators Jinhyun Hong (University of Seoul, South Korea), Katarzyna Sila-Nowicka (University of Auckland, New Zealand), and Christina Boididou (British Broadcasting Corporation) has focused on data from wearable cameras. Wearable cameras in combination with other sensors allow one’s daily life and environments to be passively and continuously captured in high-resolution images, that are linkable (with the consent of participants) to related data streams in the participants environment, or to surveys that they complete or to other concurrent data-collection activity they are involved in. Such comprehensive and “multi-modal” data collection offers the potential to generate rich contextual information on people’s activities and movement behaviors inferred from photographic images.
One recent study analyzed physical distancing in people’s daily lives and its association with travel behavior and the use of transportation modes before the COVID-19 outbreak (Thakuriah, et a. forthcoming). But very little is known regarding the extent to which we were physically distanced prior to the health emergency. What was the extent of physical remoteness among individuals engaged in everyday indoor and outdoor activities before the COVID-19 pandemic, or when there are no health emergencies in place? To what extent, if any, were transportation mode choices and travel behavior associated with levels of physical remoteness? Additionally, what role did sociodemographic factors, living and working conditions, the built environment, the level of social networks and social cohesion, and the extent of Internet use play in physical distancing during non-pandemic times? The determinants of physical distancing for members of the general public in both indoor and outdoor settings during non-pandemic times has received limited attention in the literature.
We used data from photographic images acquired automatically in a 2015 study by lifelogging devices every 5 seconds, on average, from 170 participants of a 2-day wearable camera study, as a part of a broader data collection effort involving GPS devices, and several other surveys. The multidisciplinary research approach considered the participant’s socio-demographic characteristics, living and working conditions, social networks and perceptions of social cohesion and affinity towards one’s neighborhood, level of Internet use, and other social, economic, and cultural factors that potentially influenced their physical and social isolation and interactions.
The data archive consists of 470,484 images and associated sensor readings. Figure 1 shows two examples of the image data. The measurements are extremely noisy, given the lighting conditions in the indoor and outdoor locations where they were automatically captured by the camera, the angle at which the photo was taken, camera movements when the participant walked or made other movements, or due to the way they carried the device, environmental conditions such as rain or fog if walking or bicycling outdoors, and many other critical factors such as battery consumption and storage capacity.
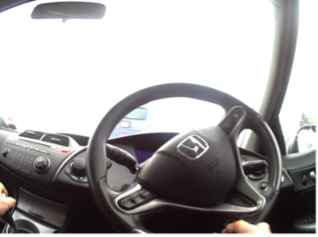
Figure 1: Image data
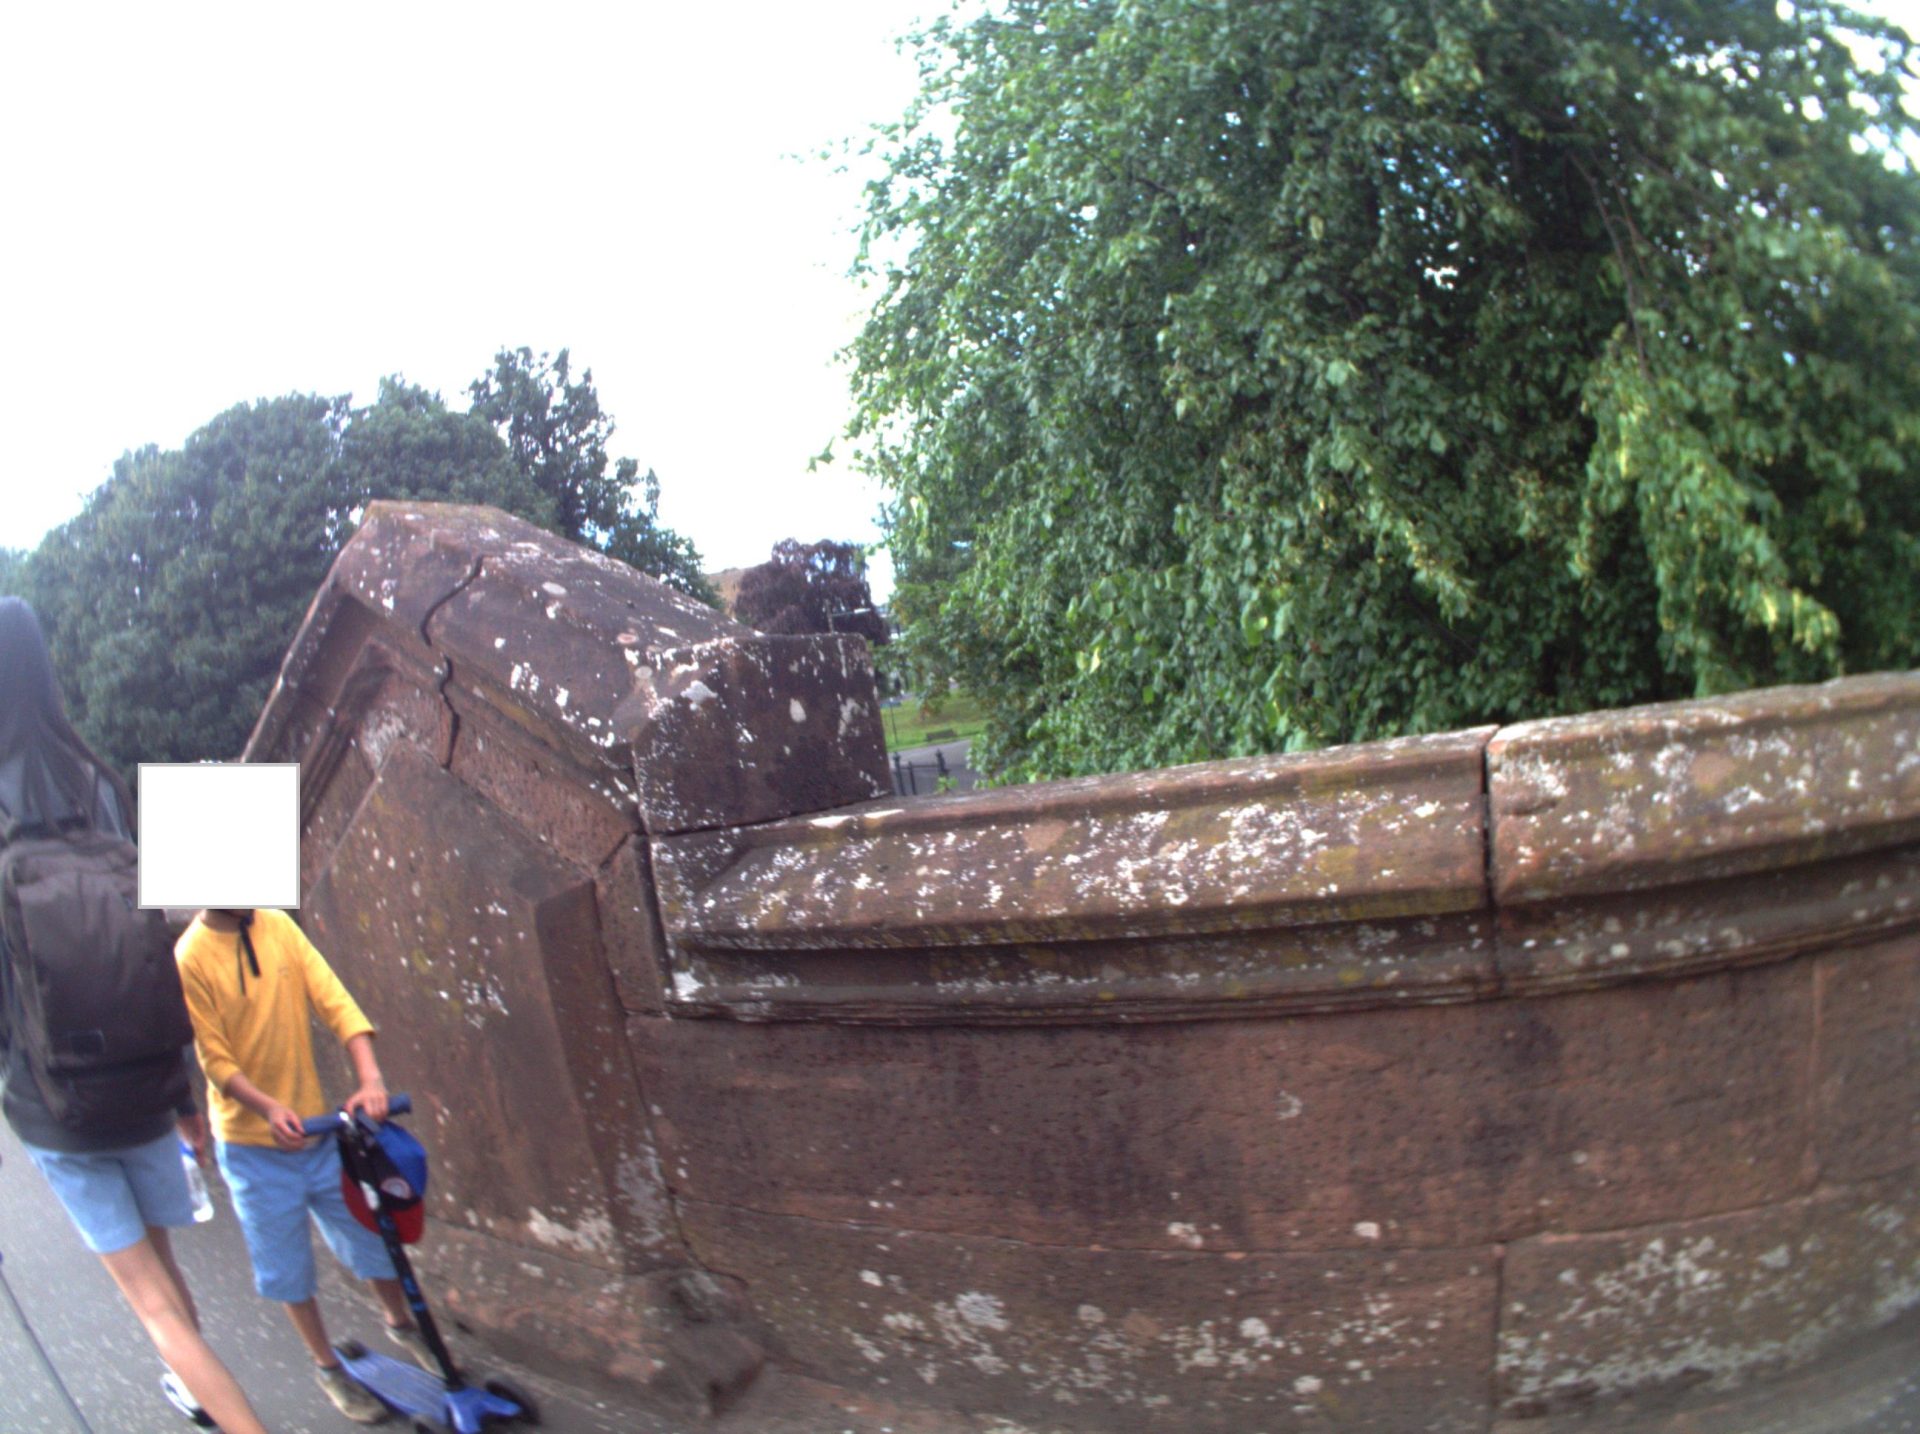
Figure 1: Image data
Our approach uses a combination of face detection technology from the dlib library on a pretrained model of 3 million faces and a ResNet network with 27 convolution layers, as well as person detection technology utilizing the Tensorflow Deep Learning library with a pretrained Common Objects in Context dataset and Faster R-CNN with ResNet. A total of 27,126 images were manually annotated with various features of interest, but a subset of 1200 images were annotated in great detail with faces and people in different postures, in indoor and outdoor contexts, and different transportation modes.
By leveraging the aforementioned deep learning computer vision algorithms on the image data, we developed three measures which provided a near-continuous quantification of the proportion of time spent without anyone else within a safer distance of approximately 13 meters, as well as the proportion of time spent without others within approximately 2 meters, and a combination of these two measures, allowing for a granular evaluation of the participant’s physical distancing context. These measures are subsequently incorporated into beta regression and multinomial logit models to explore the association between physical distancing and participants’ travel behavior and transportation choices.
We found that participants spend a significant amount of time physically separated from others, without anyone else within 2 meters. A smaller proportion of their time was spent without anyone else within 13 meters.
Figure 2 shows the probability of physical distancing for public transportation and automobile users during non-pandemic times, when physical distancing mandates are not in place. Being able to remain at a distance (of 2 meters at least) from others, declines not only for users of trains, buses and other public transportation modes. It also declines for car drivers, once the total trip is taken into account, although not to the same extent as public transportation users.
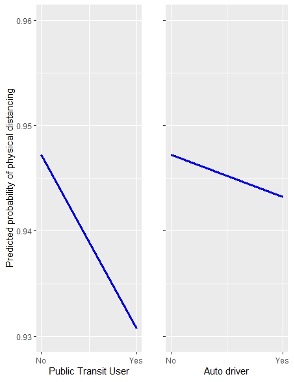
Figure 2: Physical distancing propensity of public transportation and auto users during times without health emergencies
Interestingly, we did not observe a statistically significant relationship between physical distancing and population density in residential zones. Figure 3 shows this relationship. However, higher incomes, strong social networks, and a sense of belonging to the community reduced the tendency for physical distancing. In contrast, factors such as age, obesity, dog ownership, intensive use of the Internet, and being knowledgeable about climate change issues, increased the likelihood of physical distancing.
Activity detection and time spent indoors and outdoors
Where wearable devices are able to continuously measure people’s outcomes, it is important for the analyst to know whether a participant was indoor or outdoor at the time a measurement was taken. This is because the person’s behavioral and cognitive patterns could be quite different inside a house or office, versus if they were sitting outside in a park, or walking, or driving. There are numerous ways to know where a participant is at a particular point in time – for example, through scene understanding in computer vision, or through other devices that measure luminosity or lighting conditions.
The 170 participants in the physical distancing work were a subset of the total number of participants who also carried out wearable GPS devices and filled out an experience device experience survey. However, GPS trackers do not work indoors. We developed a framework for activity recognition both indoor and outdoor by using data associated with image sensors. The sensor data used for indoor and outdoor activity detection was chosen: acceleration, magnetic field strength, luminance, orientation as well as time interval, time of the day, total time of recording and temperature, together with a Random Forest classification and a Gini-importance selection criterion. Some of this data are show in Figure 3.
Figure 3: Temperature and light intensity distributions from wearable sensor
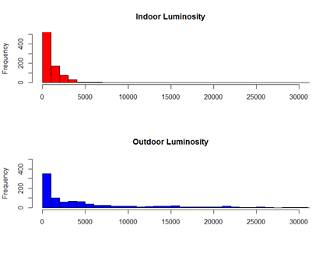
Figure 3: Temperature and light intensity distributions from wearable sensor
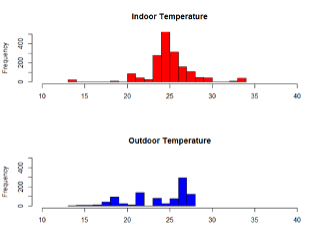
Figure 3: Temperature and light intensity distributions from wearable sensor
We found that younger men from the study (age group 1 and 2 –under 25 and between 25–65 respectively) tended to spend more time indoor than younger women, whereas for older people (65+) the reverse was true and women spent more time indoors then men. In another stream of work, we found evidence, through the use of GPS data, of greater activity, movement and engagement by those older adults who are involved in learning and education later in life (Lido, et al. 2016). We also found that the more people walk indoors, as opposed to sit or the more they walk outdoors as well. Figure 4 shows this relationship.
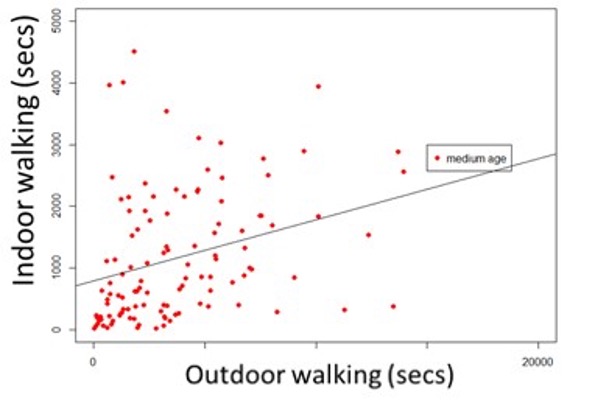
Figure 4: Relationship between amount of time spent walking indoors and outdoors
Sensing roadway disturbance and hazards using wearables
Drs Thakuriah and Sila-Nowicka further reported on detecting driver distraction and road hazards from wearables data. Wearables can provide unique data to help identify where there are hazards on the road. Historically, this type of information came from vehicle crash records, derived by highway agencies and the Fatal Analysis Reporting System from police records of crashes. Those types of data record where, when and how crashes occur, but do not offer insights into crash determinants such as driver distraction, a leading cause of motor vehicle deaths.
We define disturbance as the difference between the direction a car is heading and the body orientation of the driver. To calculate disturbance, we used an orientation calculation derived by the device’s manufacturer based on acceleration and magnetic field strength as well as the direction of travel on the road information from linked GPS data. The driver’s body orientation is the lifelogger’s orientation when attached to the driver in a forward-facing position, derived by the manufacturer using magnetometer and accelerometer readings. The body orientation may differ from the vehicle’s orientation due to a number of reasons.
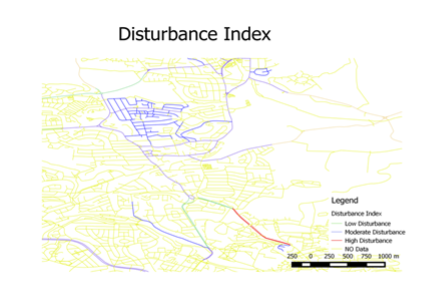
Figure 5: Disturbance index from lifelogging device and the road network
Figure 5: Disturbance index from lifelogging device and the road network
Cognitive distraction happens when a driver is not mentally engaged with his/her driving tasks, and not aware of sudden changes in the surrounding environment. A cognitive distraction could occur despite of a correct seating position of a driver. A visual distraction is when a driver is not looking at the road and therefore does not see changing driving conditions. Often these are related to lack of attention due to a secondary task such as texting, looking at mobile phone or a navigation device or just looking around while driving. The third type—manual distraction is when a driver has an incorrect hand position on a steering wheel while driving.
After calculating individual disturbances for each GPS point with the available sensor records we defined the Index of Disturbance per link/segment of the road network. Examples are given in 5. These quantities were then attached to an Open Street Map (OSM) of the road network (see image here). This high-fidelity approach therefore gives a measure of potential risk in the road network, versus actual risk. We found that for both men and women the levels of disturbance are lower on highways and limited-access roads which are roads with higher speed limits and fewer interactions with potential external distractions and pedestrians. We further found that the agitation/disturbance levels increase for both men and women with an increase in the amount of rain on residential and unclassified roads.
Stress using e-scooters and galvanic skin response
Faculty Affiliates Wenwen Zhang and Clint Andrews, in collaboration with Hannah Younes, Leigh Ann Von Hagen and Robert B. Noland, carried out a demonstration project on measuring stress when using e-scooters. They conducted an experiment using biometric sensors to measure stress and cognitive workload while using an e-scooter. A volunteer was equipped with eye tracking glasses and galvanic skin response (GSR) stress sensors while riding a short pre-defined route that included the pop-up bike lane (see Figure 2). The eye tracking glasses collected video data on what the user viewed along with the gaze and fixation of the user’s eyes. The stress sensor captured skin conductivity data, which is used to measure human stress levels.
They used a computer vision algorithm, PSPNet, that automatically segments images into over 40 different object types [see example in Figure 3] to analyze the video and eye fixation data. They found that the average eye fixation duration is longer in more relaxing travel environments and tends to be shorter in non-signalized intersections (likely because the rider has to track different moving objects). Additionally, the rider focused more on other road users (e.g., cars, vans, pedestrians, cyclists) at the intersections compared with traveling along road segments, where the volunteer paid more attention to road amenities (e.g., trees, bushes, buildings), see Figure 6.
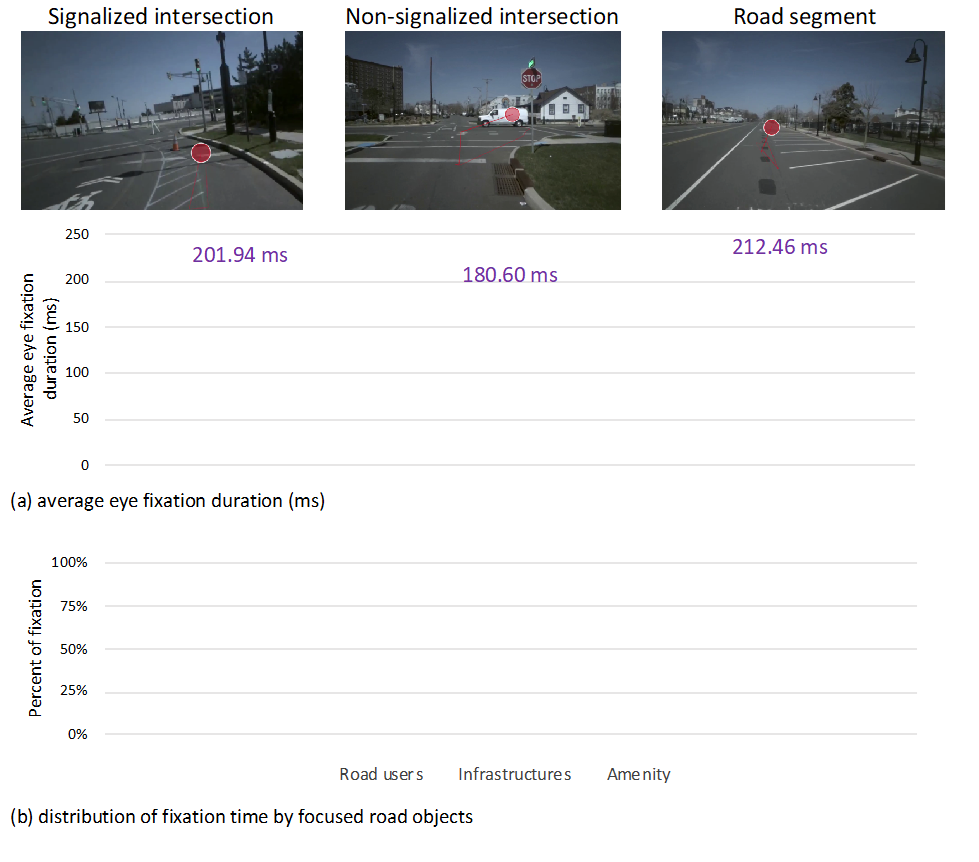
Figure 6: Preliminary eye tracking results from e-scooter study
Additional Readings
- Thakuriah, P., C. Boididou and J. Hong. Physical distancing and its association with travel behavior in daily pre-pandemic urban life: An analysis utilizing lifelogging images and composite survey and mobility data. Forthcoming in Environment and Planning B: Urban Analytics and City Science.
- Thakuriah, P., K. Sila-Nowicka, J. Hong, C. Boididou, M. Osborne, C. Lido, A. McHugh (2020). Integrated Multimedia City Data (iMCD): A Composite Survey and Sensing Approach to Understanding Urban Living and Mobility. In Computers, Environment and Urban Systems. https://doi.org/10.1016/j.compenvurbsys.2019.101427
- Sila-Nowicka, K. and P. Thakuriah (2019). Multi-sensor movement analysis for transport safety and health applications. In PLoSONE 14(1). https://doi.org/10.1371/journal.pone.0210090
- Thakuriah, P., K. S. Nowicka and J. D. G. Paule (2016). Sensing Spatiotemporal Patterns in Urban Areas: Analytics and Visualizations using the Integrated Multimedia City Data Platform. In Journal of Built Environment, Vol. 42(3), pp. 415-429. http://www.jstor.org/stable/44132288
- Lido, C., Osborne, M., Livingston, M., Thakuriah, P., and Sila-Nowicka, K. (2016) Older learning engagement in the modern city. In International Journal of Lifelong Education, Vol 35, pp. 490-508. https://doi.org/10.1080/02601370.2016.1224037
- Sila-Nowicka, K., and Thakuriah, P. (2016) The trade-off between privacy and geographic data resolution. a case of GPS trajectories combined with the social survey results. In: XXIII ISPRS Congress, Prague, Czech Republic, 12-19 Jul 2016, pp. 535-542. doi:10.5194/isprs-archives-XLI-B2-535-2016