

A lot has changed in New Jersey since the beginning of COVID. Dr. Vonu Thakuriah and RUCI Lab researchers have used a variety of data sources to track how places and people’s movements are changing over time, as we move beyond the health emergency.
Based on cell phone data, we found that in the first few weeks and months after the health emergency, travel levels to over 150,000 Points-of-Interest throughout NJ, including retail, commercial, healthcare, food establishments and other essential and non-essential establishments, dropped 80 percent compared to the first week of March. After a gradual decline in the second week of March, there was a sharp drop over the next two weeks to the lowest levels of travel, starting the week of March 22. Reduction in travel varied by county, with the greatest declines in the northern and central counties.
In addition to the drop in the volume of trips made, distances travelled and time spent at each location also declined. The shortest visits distance-wise were to locations in the northern counties which experienced the highest incidence of Covid-19 cases. Generally, the time spent at travel destinations was higher as well in those areas. In terms of travel, there was a greater slowdown in areas with higher prevalence of the disease, as shown in Figure 1.
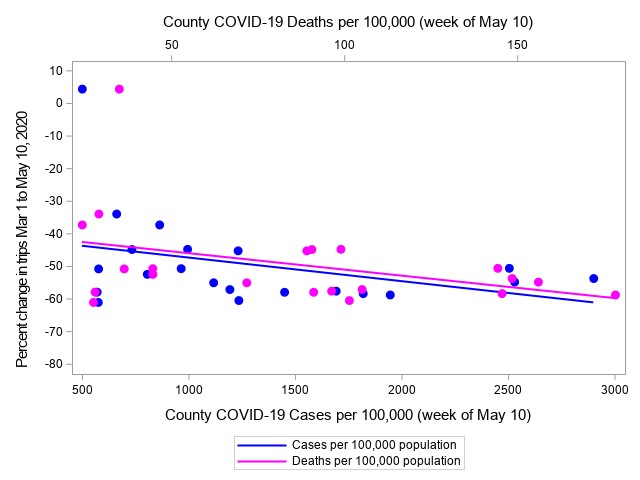
Figure 1: Percent changes in all visits by NJ county-level COVID-19 cases and deaths. Source: Safegraph, NJ DOH, ACS
Travel levels also varied by poverty levels, and by purpose of the visit. In towns and cities with higher COVID cases, food shopping trips, for example, decreased more compared to the pre-crisis period, as poverty levels increased. In contrast, in places with low COVID levels, as poverty levels increased, food shopping trip rates decreased less, compared to early March.
The longer people traveled to a location during the lockdown, the less time they spent at that location, undoubtedly to reduce the total out-of-home time. When people traveled farther to buy food, alcohol and related items, however, they also spent more time in those facilities, probably because they had to wait in line to enter the store, and because they shopped for larger quantities of goods.
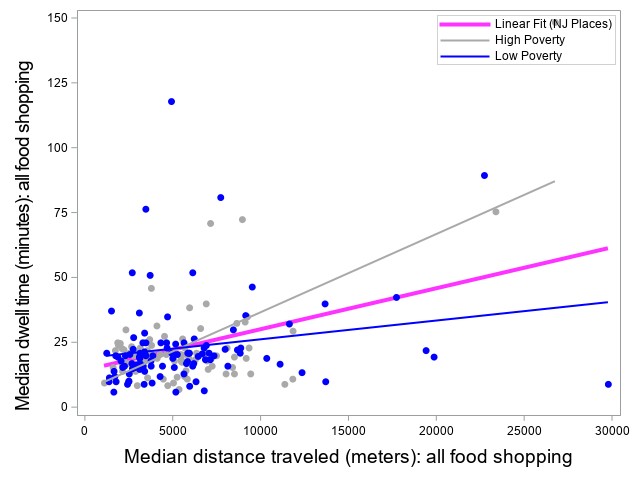
Figure 2: Dwell time and distance traveled for food shopping by poverty level
People doing food shopping in poorer areas with low COVID-19 cases, either by choice or due to financial hardship, made more trips. Inability to transport back large quantities of goods without access to a car or not having the ability to pay for large quantities of groceries during a single visit may have played a role in more frequent food shopping trips.
As distance traveled to healthcare facilities increased in low poverty areas, time spent at the healthcare facility increased. However, in high poverty areas, even after traveling long distances, there are places where the average time spent at health services facilities was quite short – less than 50 minutes. It is possible that telehealth may have been an option in such cases, instead of a physical trip.
Telecommuting
Over time, travel remained down for a while, but has now rising back to pre-pandemic levels. After a lengthy period, ridership in NJ Transit is getting closer to pre-pandemic levels, as can be seen from Figure 4.
Figure 4: NJ Transit ridership over time. Source: transitapp.com/APTA
As we settle into a “new normal”, one of the most critical long-term changes seem to be in having the continuation of remote working and hybrid work. By many accounts, the remote or hybrid work trends brought upon suddenly by COVID are here to stay. In the early days of the pandemic, office attendance fell by 90% in New York City and San Francisco. Over the last three years, there has been a transition from remote to hybrid work. A recent McKinsey report, workers were going to the office just 3.5 days on average. A new Pew Research Center survey found that in February 2023, about 35% of workers with jobs that can be done remotely are working from home all of the time, while 41% are working a hybrid schedule.
The long-term implications of these trends are substantial, which is something that has been talked about extensively in both the academic literature as well as the popular press. Some of the key areas where long-term impacts have been projected include reduced office occupancy and changing commercial real estate needs, reduced foot traffic and decline of supporting businesses, shift in housing demand away from urban centers, and even decreased social interactions among workers, which may have unintended effects on collaboration, innovation and team cohesion.
But the demand for travel has changed in fundamental ways. And one sector where the impacts are still being felt is in the reduced demand for public transportation. Figure 1 shows data from transitapp.com, and are differences since before the pandemic using ridership values that are modeled based on measures of the Transit app usage (they are not actual reported ridership counts from agencies).
However, there is very little continuous data on the localities where telecommuting levels are declining, or where the levels have remained closer to pandemic levels. These numbers of course are system-wide, and do not show the granularity of where specifically estimated ridership is bouncing back vs where ridership is remaining stagnant. The geographical granularity of where ridership demand is increasing rather than falling or staying the same is vital, not just for transit planning, but also for planning local services. Rather than trying to get station-level data from transit agencies across the country, which would be a heavy lift, if it were available in a timely manner, we report here another approach.
There is a need to consider changes in telecommuting rates by small geography. However, telecommuting rates on recent and ongoing basis are not available by smaller geographies. By means of blended data which we created from surveys and other sources using machine learning technology, we are able to have an idea of which census tracts are remaining more remote/hybrid over time, vs where workers are going back to work in-person. We have developed machine-learning based small-area estimation processes for this purpose. The goal is to develop estimates (at census tract level) what the potential there is for telecommuting versus commuting to work. We put together multiple sources of data including small-area estimation of the Household Pulse Survey, Current Population Survey’s monthly records and ACS data to estimate census tract-level telecommuting levels at multiple time period post-2020.
These “small area estimates” in New Jersey census tracts are shown in Figure 5, where the census tracts in the map are color-coded by the extent to which telecommuting proportions have changed between early 2020 and late 2022-early 2023. The blue color indicates where telecommuting proportions in 2022-2023 have remained closer to the levels in the early pandemic days. The red color shows where the differences between 2022-2023 and early 2020 are larger, ie, where in-person work has recovered more. The yellow dots represent NJ Transit stations and stops. Public transportation is quite clustered within the state, with availability levels better for certain areas.
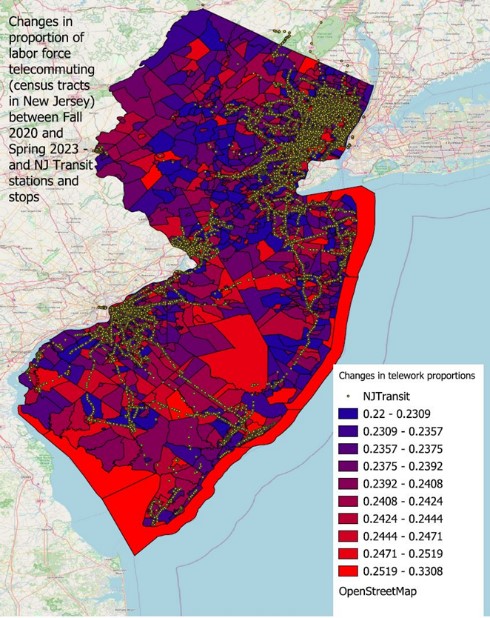
Figure 5: New Jersey telecommuting changes – Fall 2020 and Spring 2023
The map shows that based on our work, dynamic telecommuting estimates for Spring 2023 remained closer to the early days of the pandemic for areas that are better served by transit. In contrast, areas that are less well served by transit have experienced higher return-to-work rates and lower levels of remote and hybrid work. It is quite possibly that auto travel to work has regenerated to pre-pandemic levels to a greater extent compared to travel by public transit. The implications at least in the short-term horizon for fares and revenues are considerable, if these trends were to remain.
More on COVID movement patterns and visualization!
Interactive Dashboard: Business Foot Traffic During Phase 1 NJ Lockdown
Bloustein School MCRP/MPI graduate Haoyun Wang joined the RUCI Lab during the summer of 2020. For his internship project, Haoyun worked to create an interactive dashboard that integrated anonymized cell phone location data tracking visits to points of interest throughout the state during the first phase of the pandemic.
Visualizing the Spread of COVID-19 in the United States
Mr. Gavin Rozzi, former data scientist at RUCILAB